This post may contain affiliate links. We may receive compensation when you click on links to those products at no additional cost to you. Read our full disclosure here.
Investing in stocks has been the name of the game in growing your wealth over time. However, not many actually know how to research stocks analytically to make an informed decision when investing their hard-earned money. For those that want to know more about what stocks are, read this article first to get a better understanding of what financial markets are.
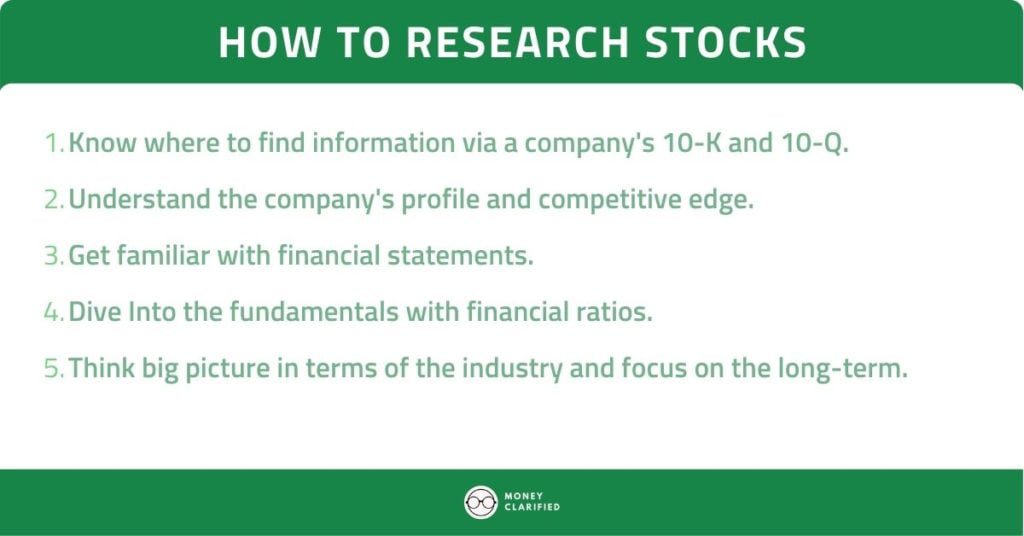
In this article, I’ll list down 5 easy steps that I use when researching stocks using to get a good understanding of the company before investing.
How to Research Stocks
1. Know Where to Find Information
The first thing you’d need to do is to gather all the information you may need to research the company you’re interested in investing in. Every publicly traded company in the United States is required to file different reports with the US Securities and Exchange Commission (SEC). The two main reports that you’d want to take a look at are:
- 10-K: An annual report that details the company’s business, leadership, financial statements, risks, competition, outlook, and just about anything you need to understand the company. This report is independently audited by a third party.
- 10-Q: A quarterly report that provides a quarterly update on the company’s operations and financials. The financial statements are not audited and the report is less comprehensive than a 10-K.
So where can you find these reports?
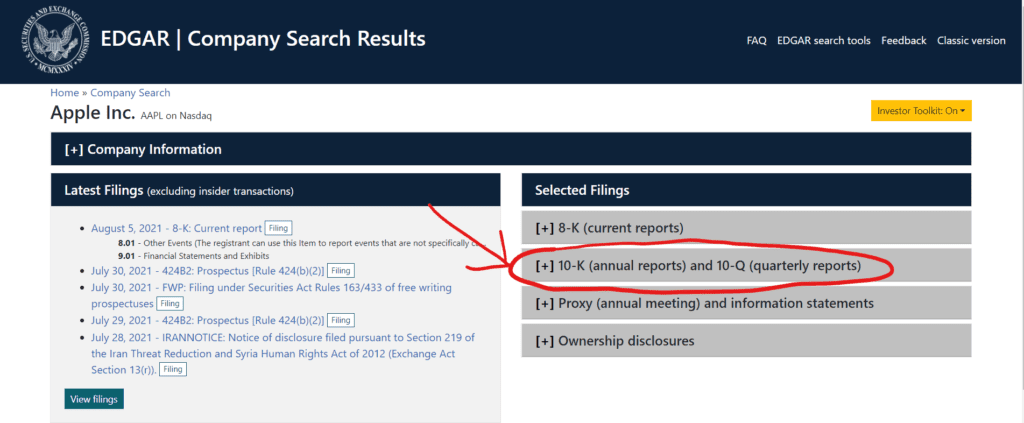
- SEC Edgar: Type in the company’s ticker symbol or name in the search box.
- Company’s website: You can find the relevant reports under the “investor/investor relation” section of their website.
10-Ks and 10-Qs are typically very long, comprehensive, and wordy. If you want to view it in a more structured format and identify the highlights easily, you can do so via:
- Your brokerage website or apps like Robinhood and Webull
- Major financial websites like Yahoo Finance and CNBC
- Investment research tools like Seeking Alpha and Morningstar
2. Understand the Company’s Profile and Moat
With the company’s information in hand, it’s time to perform your due diligence. A great place to start is to understand the company’s business model and management. This is crucial as you really want to know what you’re investing in and not just blindly buying a stock.
Key components of a company’s business model you should take note of include:
- The organization and management team
- The captain of the ship will determine how the ship is steered. Taking a deep dive into the company’s management and company culture can give you insight into what to expect in the future as an investor.
- Some things to look out for include experience, personality, qualifications, network, chemistry, etc.
- Products and services that fill a need and/or solve a problem
- Consumers are always looking for solutions to their needs/problems. A company that can provide a solution will have demand for its products and services to generate revenue and grow a loyal customer base.
- Knowing the market potential of a product and/or service is also important as well as you want to know the scalability of the company. For example, the electric vehicle market is expected to grow to $725 billion in 2026, which leaves plenty of room for growth and an attractive investment opportunity for some companies.
- Revenue sources
- Some companies have more than one revenue source. This is good as a diversification of revenue can provide some safety net in case a revenue source depletes. Innovative companies will also find ways to diversify revenue and capture more market share for their products and services.
- Target customer segments and market
- Understanding the company’s target customers is helpful to determine if the business is sustainable or not. Knowledge of the target market can give insight into their marketing and communication strategy that can create brand loyalty.
- Economic moat
- Once you understand a company’s business model, you can then identify its economic moat.
- An economic moat is a key advantage that makes a company stand out from its competition to protect its profitability and market share from competitors.
- For example, Google’s moat is its search engine and brand. Many search engines have come and gone but none come close to Google’s throne. With this moat, Google is able to generate massive advertising revenue and integrate various products and services to solidify its moat.
- It is good practice to identify 2-3 of the company’s competitors and identify what makes the company stands out. If the company doesn’t have any competitors, review the barriers of entry and how easy it is for competitors to emerge.
Knowing a company’s moat is essential as you want to make sure that the company you’re investing in can retain market share and increase profitability sustainably in the long term.
3. Get Familiar With Financial Statements
A company’s financial statements show you how the business is doing financially and are crucial when learning how to research stocks. It also gives one insight into how the company is managing its money and operations. These financial statements can be found in the company’s 10-K, 10-Q, and other platforms listed in the first point above.
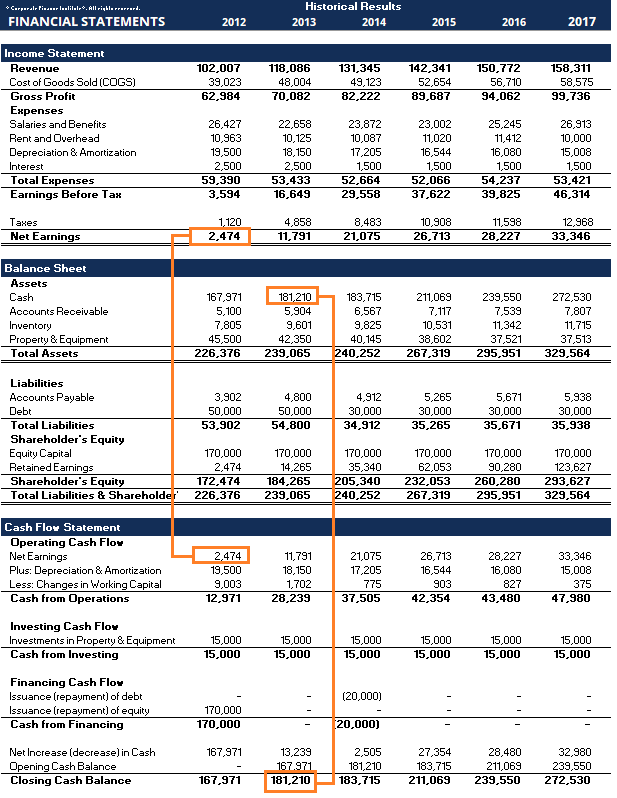
There are 3 main financial statements you’ll need to know:
- Balance Sheet: Provides a snapshot of the company’s net worth, which is essentially what they own and what they owe, at that time. Net worth = assets – liabilities.
- Income Statement: This shows you the revenues and expenses of the business. Used to assess a company’s profitability.
- Cash Flow Statement: This shows you where cash is coming from and going. Gives you a clear picture of cash movement without any accounting gimmicks.
If you’re new to financial statements, check out this video to get a clearer understanding of what they are.
Identify Trends
When you look through the different line items in the financial statements, it is important to look for trends to see how the company performed over time. Aim to look at a period of at least 5 years to have a better picture of what is going on. Some line items that I like to analyze are:
- Revenue growth – Has the company’s revenue growth been growing? For growth companies, aim for annual revenue growth of at least 10% for a healthy growth rate. A company with declining growth can be a red flag that they are not able to scale the business effectively.
- Net income growth – It is often not about what you make, but what you keep. The same goes for companies. Review if the company’s profit or net income is growing and find out the “why” if it’s not.
- Operating Income – Operating income reflects how much the company is making after taking out operating costs. It gives a clean look at the company’s raw profit without the impact of taxes and other one-off items.
- Cash – How much cash does the company have? If the company is low on cash, it may be a signal that the company may need to raise funds by issuing shares or taking on debt.
- Free Cash Flow – Free cash flow is the cash generated by a company after paying for a business’ capital expenditures with cash from operations. It is a helpful metric as it shows the company’s financial health in terms of cash flow without any accounting gimmicks from non-cash items. The free cash flow that a company generates can be used to pay dividends, pay down debt, reinvest in the business, etc.
- Debt/Liabilities – How much debt does the company have? Using a financial ratio like the debt-to-equity (DTE) ratio may be helpful in determining if the company has too much debt or not.
4. Analyze Financial Statements With Financial Ratios
Once you understand how to read financial statements, you can use financial ratios to help you analyze the company even better when learning how to research stocks.
What are financial ratios?
- Financial ratios are helpful to conceptualize key indicators and extract powerful information about the financial and operational health of a company.
- Financial ratios are also helpful to compare the company against other companies in a similar industry.
- The four main categories of financial ratios I like to use when researching stocks are profitability, liquidity, solvency, and market value.
Profitability
Profitability shows the company’s ability to generate a profit relative to its revenue, costs, operations, and shareholder’s equity. Here are some of the key metrics I look at:
- Gross Profit = Sales – Cost of Goods Sold
- How much the company makes from sales after deducting direct costs for the business.
- Profit Margin = Net Income / Revenue
- Shows a company’s profit as a percentage of revenue.
- A high-profit margin means that a company is retaining most of its revenue while keeping expenses low.
- Personally, I like companies with profit margins that are increasing steadily or are at least 10% or higher to have more wriggle room for a rise in costs.
- Return on Invested Capital (ROIC)= Net Operating Profit After Taxes / (Debt+Equity)
- Shows how much after-tax profits a company is generating with all its invested capital.
- The calculation excludes interest payments to reflect the profit generated from its operations cleanly.
- When investors provide capital to a company, they expect to generate returns. ROIC will show if the invested capital are generating profits for the company effectively.
Liquidity
Shows the company’s ability to pay off short-term debts that are less than 12 months.
- Current Ratio = Current Assets / Current Liabilities
- AKA Working Capital Ratio
- Shows how many times a company can cover its short-term obligations with their liquid assets.
- A ratio between 1.5 and 3 is considered good.
- Quick Ratio = (Current Assets – Inventory) / Current Liabilites
- AKA Acid Test Ratio
- Similar to current ratio but removes inventory as a company will need to actually sell the inventory to come up with cash, making it a little less liquid.
Solvency
Shows the company’s ability to meet long-term debt obligations. Companies that use too much debt may be at risk of bankruptcy if it is unable to meet its obligations.
- Debt-to-Equity (DTE) Ratio = Total Liabilities / Shareholders’ Equity
- Shows you how much debt a company is using for every dollar of ownership. For example, if a company is worth $10 and I own $8 of it, the other $2 is financed by debt. The Debt to Equity ratio of my company is $2 / $8 = 0.25.
- Debt can be good as it can generate higher returns if used wisely without sacrificing ownership.
- However, too much debt can signal that a company is in distress and can be at risk of going bankrupt if it fails to pay up.
Market Value
- Price-to-Earnings (P/E) Ratio = Share Price / Earnings Per Share
- Earnings Per Share (EPS) is calculated by dividing net income by number of shares outstanding.
- The P/E Ratio of a company shows you how much an investor is willing to pay for every dollar of earnings.
- A high P/E ratio can mean one of two things:
- The company is overvalued compared to its peers as investors are bidding the price up even though earnings are lacking to justify the high price.
- The company is expected to grow significantly in the coming years and investors are willing to pay more now to capture that earnings growth. Companies with high P/E ratios might be classified as a “growth” company.
- A low P/E ratio can mean one of two things:
- The company is undervalued compared to its peers.
- The company is earnings growth is expected to slow down and investors want to pay less now as it’ll take longer for them to recoup their investment in terms of earnings per share. Companies with low P/E ratios might be classified as a “value” company.
- P/E ratios are most valuable when comparing to other companies in a similar industry.
- Price-to-Earnings Growth (PEG) Ratio = P/E Ratio / Expected Earnings Growth
- Different companies grow at a different rate. The PEG ratio helps to value a company based on its expected earnings growth in the future.
- You can use the growth rate provided by analysts to calculate this ratio.
- If a company is expecting high growth in the future, investors may be more willing to pay a higher price now for that growth.
- As a rule of thumb, a PEG ratio of more than 1 is considered overvalued and less than 1 is considered undervalued.
- Price-to-Book (P/B) Ratio = Share Price / Book Value Per Share
- Book value Per Share = Assets – Liabilities / Number of shares outstanding
- Book value tells what the company will have on its books if it uses its assets to pay off all its liabilities.
- It is often viewed as a conservative measure of a company as common sense tells that a company should be at least worth what it has on paper.
- Traditionally, a price to book value of less than 1 means it is undervalued as the stock price is priced less than its book value per share.
- It is important to compare P/B ratios across other companies in the same industry to have a better gauge of whether its overvalued or undervalued.
- Price-to-Free Cash Flow (P/FCF) Ratio – Share Price / Free Cash Flow Per Share
- Free Cash Flow = Operating Cash Flow – Capital Expenditure
- Cash flow is a straightforward measure of the health of the company as it shows how much cash the company is generating without the accounting gimmicks that can be used to manipulate earnings.
- P/FCF ratio is useful when comparing with other companies in the similar industry to determine if its over or undervalued.
- I personally like to buy companies that have at least a positive cash flow.
5. Think Big Picture and Long-Term
When you invest in a stock, you want to ensure that there is the long-term growth potential for both the company and the industry. As the industry and your company grow and innovate, you as the investor will profit from riding the wave and letting your investments compound.
For example, investors who foresaw the growth of e-commerce in the 2000s will be reaping the rewards now if they bought Amazon stock and held them for the long term.
Some good questions to help you think long-term:
- How do you see the company perform in the next 5 years? Or 10 years?
- Does the company have the management, resources, and team to execute its vision?
- How is the industry performing and evolving?
- Could there be any regulatory implications that will affect the company’s growth?
Risks
Thinking long-term also means considering the company’s risks as well to manage your expectations and be ready if your investment thesis fails. The company’s risks can be found in the company’s 10-K so be sure to read through and understand that.
This is why it is very important to learn how to research stocks and diversify your investments to avoid wiping you out if one company does badly.
Conclusion
Investing in individual stocks is risky and requires proper due diligence and research. No one can predict the future but knowing what you own will certainly give you an edge and the conviction to hold your stocks for the long-term as long as your bullish investment thesis remains intact. Once you purchase a stock, be sure to stay updated on any developments that can affect the company’s share price and future. Remember, owning stock makes you part owner of the company!
Pro tip: Check to see if your brokerage provides any free analyst reports to make your research process of how to research stocks easier!
The opinions expressed in this article are for general information purposes only and are not intended to provide specific advice or recommendations about any investment product or security. If you have questions pertaining to your individual situation you should consult your financial advisor.
This post may contain affiliate links. We may receive compensation when you click on links to those products at no additional cost to you. Read our full disclosure here.
")

